Development of Services for FASTPRK2 by Worldsensing

Duration of the project:
October, 2017 –
January, 2018
Client
Project Manager
inLab FIB Team:
Participants
  • Jose Gorchs
Areas of expertise involved in the project
Technology
Development of Services for FASTPRK2 by Worldsensing

Description

The project consisted of the improvement of pre-existing services and the creation of those that were not yet developed by the Fastprk2 system and its integration with Mobility.

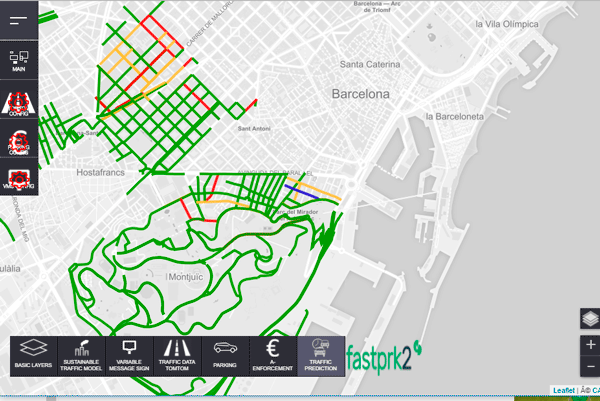
Mobility is a control panel based on a map where geolocated information of all kinds can be displayed. In our instance, the information we display is information related to: Traffic, Parking, Information Panels and Environmental Sensors.

The services are divided into two categories, the configuration services (left side of the control panel) and the information services (bottom side).

The configuration services we have developed are:

  • Configuration of traffic sections. An integration has been made with the TomTom API to obtain the sections and traffic data and with the Google APIs to obtain the street names.
  • Configuration of the way in which the parking lots managed by the FastPark2 platform are to be displayed.
  • Configuration of information panels to place them on the map and manage the information they display.

The services that display information are:

  • Environmental sensors, the Airvisual API has been integrated to visualize the measurements of the sensors in different cities and their evolution during the last month.
  • Parking incidents. By APIs we consult the free spaces, the occupied ones, those that have paid and those that have not in order to indicate to the parking lot managers if there is any type of incident.
  • Parking spaces, by means of several APIs we consult the free spaces of each parking lot, a history of the occupation is shown and a graph with the prediction of how the occupation of that parking lot will be. A feature called “dynamic pricing” has also been implemented, which allows the price of parking to be adjusted according to occupancy.
  • Traffic forecasting data. The traffic forecast is displayed for each of the sections at 1 hour ahead. It is also possible to visualize the evolution of the speed on that stretch during the last week, how it is expected to be during the next hour, the median speed of that stretch, etc.

All these services have been implemented using a microservices architecture based on Docker containers.