
The inLab FIB is currently collaborating on a project called Intelibus, in conjunction with mobility company Autocorb and ICT software development company Geoactio, to develop a system for predicting passenger occupancy on buses.
The inLab FIB is currently collaborating on a project called Intelibus, in conjunction with mobility company Autocorb and ICT software development company Geoactio, to develop a system for predicting passenger occupancy on buses. Due to the Covid-19 pandemic, the implementation of this feature has been accelerated, as it can help curb infections and prevent congestion: if people are informed of how full the buses will be in advance, users will be able to choose to travel on buses that go more empty. In this blog article we explain what prediction methods and algorithms we use and we will take the opportunity to go into some detail in machine learning models such as neural networks.
In the field of artificial intelligence there are many ways to address a prediction problem like this: through simulation, estimating demand, implementing heuristics, using machine learning/deep learning, etc. Since bus companies often store data and travel history of each bus, it opens up the possibility of addressing the problem with supervised learning, that is, training models with data labeled with what we want to predict. In the Intelibus project we have data from 3D cameras inside the buses that count the people who get on and off at each stop. If we put this data together with information from the different bus lines, calendar information and passenger validation histories, we would already have the data needed to be able to train neural networks that predict employment at each stop.
What is training a model?
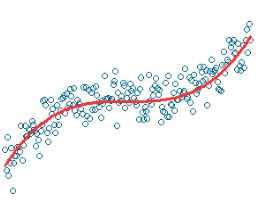
When we talk about training a neural network, what we really want is to adjust the parameters of a function (neural network) so that it learns a specific task, that is, that it learns to map inputs to outputs. This is achieved by using large amounts of data to minimize the prediction error of the model with respect to these. Does the “chain rule” that you were taught to derive sound like and you thought you would never hear about it again? Well, the training process of a neural network is based mainly on the ingenious application of this rule, which allows us to calculate how the network parameters should be modified to minimize the prediction error iteratively.
In our case, we want the model to learn to calculate the occupancy of the buses at each of the stops where they pass. So we must give the model as input a numerical representation (vectors) of the information of the bus, the stop, the calendar, etc. and we want you to return the number of passengers there will be, as shown in the following image. With histories of a few previous months we can already get a pretty good prediction accuracy. 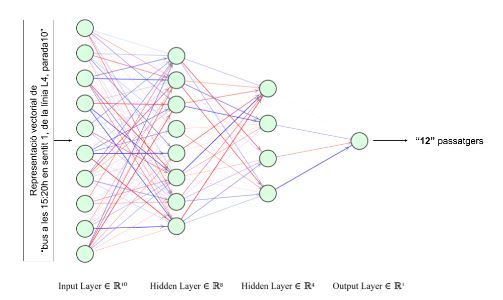
The grace of using neural networks is that they allow us, with a single model, to be able to predict on any of the bus lines in each one of the stops, without having to make a model or specialized algorithm for each one of the lines. This simplifies the complexity of implementation when it comes to production and also allows it to be easily applied in other cities, where lines and stops will be completely different.
Temporary series: Recurrent neural networks
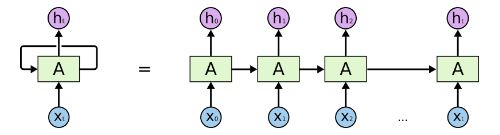
However, we can do better. The model we have just presented does not take into account the previous occupancy of the previous stops, which is very relevant information and knowing it can greatly affect the occupancy of the next stop. For these types of problems that are treated sequences there is a type of neural networks called recurrent networks (Recurrent Neural Networks), which allow us to work with time series taking into account the previous values of use to predict the next stop. To get an idea of how they are, the following image shows a simplified diagram of how the information flows from inputs to outputs. What they do, in short, is to encode the information of the previous stops in a compact way to, finally, obtain a vector (ht) that contains all the compressed information of the sequence from which we can predict the following use value. Thus, with this neural network architecture we obtain better results, since the model can capture the changes and patterns in the use of passengers over time.
In conclusion, we see that these models based on neural networks are very versatile, and allow us to solve a wide variety of problems very effectively and accurately if we have the necessary data.
References
Predicció d’ocupacions a l’autobús (https://www.autocorb.com/prediccio-ocupacions-bus/)
Neural Networks and Deep Learning (http://neuralnetworksanddeeplearning.com/)
Understanding Neural Networks (https://towardsdatascience.com/understanding-neural-networks-19020b758230)
Hochreiter, Sepp & Schmidhuber, Jürgen. (1997). Long Short-term Memory. Neural computation. 9. 1735-80. 10.1162/neco.1997.9.8.1735.