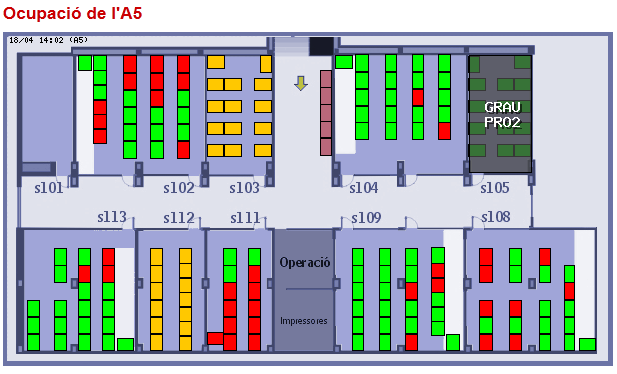
Real-time occupancy of the computer laboratories
Duration of the project:
September, 2006 –
February, 2012
Client:
Project Manager:
Areas of expertise involved in the project:
Home » Success Stories »
Real-time occupancy of the computer laboratories
Description
This project makes it possible to view via web and in real time, the occupancy status of the equipment in the computer laboratories.
For each of the classrooms, a map appears where you can see the laboratories and terminals with a different color depending on whether the terminal is free or occupied.
The data collected is used to obtain statistics on the use of the systems: average time per connection, operating systems used, etc.

