
One major challenge faced by individuals with reduced mobility when travelling with their own vehicles to new areas is the lack of information about where to find accessible parking spots places and their usage constraints. While some large cities offer this information through official platforms such as the city hall webpage or mobile application, this is not a universal standard and often this information is not available for small towns. This study proposes a solution to alleviate these issues through the detection of accessible parking spots using artificial intelligence on satellite imagery. The aim is to develop an up-to-date database that can be used by interactive maps and mobile applications to enable users to locate accessible parking spaces and access detailed information about their characteristics and usage regulations.
Introduction and context
Individuals with reduced mobility (PRM) often face significant challenges when attempting to locate parking spaces in unfamiliar cities or towns. These issues are further exacerbated by the absence of a standardized set of regulations as, historically, each city council has been responsible for managing the rules governing accessible parking spots and that the rules governing mobility accessible parking can differ significantly between cities. Key differences include:
- Permit requirements: Some cities mandate a specific permit identifier for PRM vehicles such as a blue badge.
- Traffic sign symbology: The design of traffic signs for accessible parking can vary, with differences in symbols, colors, or shapes.
- On-street indications: Cities may use different methods to mark accessible parking spots, such as traffic signals, road markings, or a combination of both.
- Permission for restricted zones: Rules regarding the use of delivery zones or time-restricted parking areas by PRM individuals can vary, with some cities allowing access and others imposing restrictions.
To address these challenges, both public authorities and non-profit organizations have undertaken complementary initiatives. At the policy level, the European Union has issued several key frameworks—most notably the INSPIRE Directive EU (b), the European Accessibility Act EU (a), and the Urban Mobility funding programmes EU (c), which collectively mandate the harmonization, publication, and interoperability of geospatial and accessibility data across member states, thereby promoting the provision of designated PRM parking spaces, the adoption of best practices inurban mobility planning, and improved access to information about these locations.
Concurrently, non-profit organizations utilize web portals and mobile apps to gather and share PRM parking information, primarily through two data acquisition methods:
- City Hall Open Data Portals:
• Municipalities publish geospatial datasets (e.g., GeoJSON, CSV) containing GPS coordinates, time restrictions, and special notes for PRM spaces.
• Some portals offer APIs for real-time availability queries via parking sensors or ticketing systems. - Volunteer-Driven Crowdsourcing:
• Volunteers identify and record accessible parking locations, upload photos, and document on-site conditions (e.g., markings, signage) using standardized digital forms.
• Data collected includes spot type, signage clarity, surface condition, and proximity to access points.
However, both approaches have limitations. In the case of open data, the information provided by city halls is often outdated or unavailable, particularly in smaller towns. For crowdsourced data, the accuracy and consistency of the reported information can be difficult to verify, as it depends heavily on the goodwill and diligence of contributors.
It is within this framework that the non-profit association AsoPMR, dedicated to inclusive mobility, aims to digitize accessible parking information via its Park4Dis mobile application. However, maintaining an up-to-date database using existing costly and inefficient data collection methods remains a significant challenge. In light of the foregoing, this study seeks to address the following research questions:
- Are there alternative strategies for obtaining information on the location of accessible parking spaces?
- What types of information can be acquired through these alternative strategies, and what are their principal limitations?
- How can the variability in signage and marking conventions across different municipalities be managed?
- Is it possible to maintain a consistently up-to-date database of accessible parking spaces?
- Can an automated system be designed to update such a database in real time?
- If such an automated system is feasible, what is its expected reliability?
The answers to the previous questions will be used in order to develop a novel solution for the automated, global detection and maintenance of an up-to-date accessible parking database, accessible via interactive web or mobile applications (e.g., Spot4Dis).
1. Hypothesis
To address the research questions, the following conditions and potential solutions are considered:
- Data Gathering: An automated mechanism for direct collection of PRM parking data from primary sources, capable of timely detection of additions and removals.
- Location: Georeferenced parking data with high positional accuracy.
- Robustness to Signal Disparity: Ability to identify PRM spots regardless of varying signage.
- Restriction of Use: Provision of information regarding usage restrictions.
Given these conditions, the proposed solution employs a visual system within a mechanism to detect PRM parking spaces in image data, mirroring volunteer-driven localization efforts. This involves identifying designating signs or markings in images (potentially street-level panoramas or aerial/satellite imagery) and precisely recording their locations. Object detection methodologies will then identify PRM spaces and determine their geographic coordinates and relevant information for database storage.
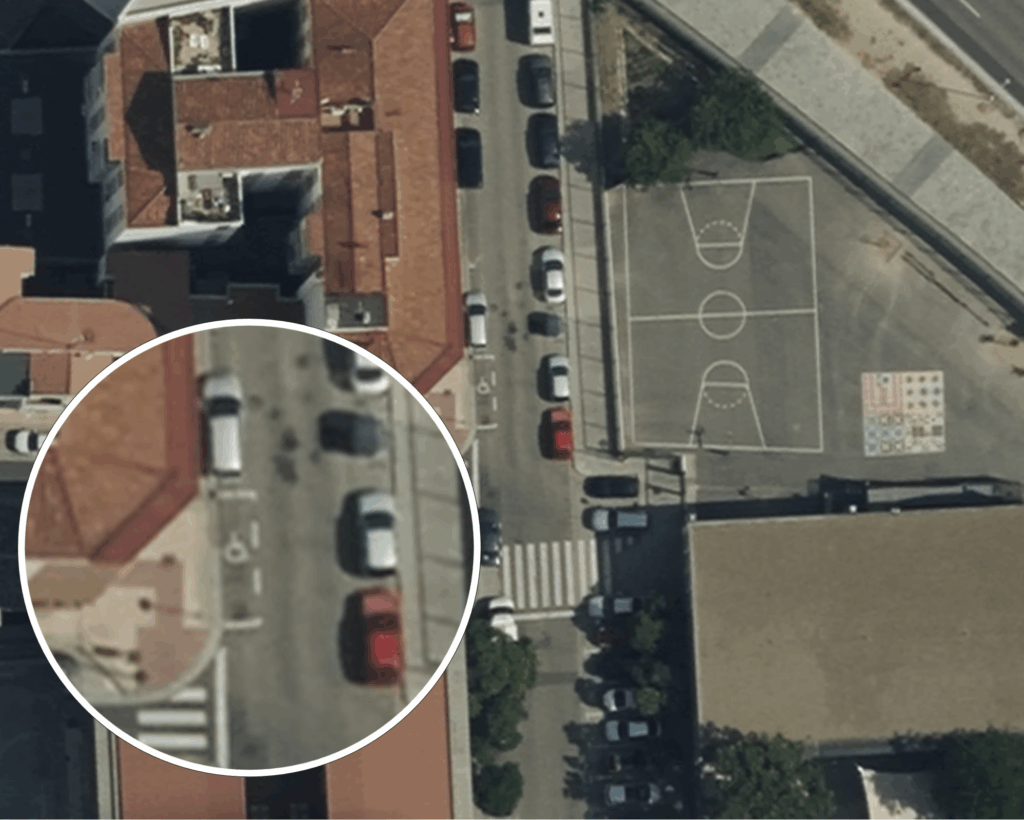
This study proposes a novel solution leveraging satellite imagery (Figure 1) and artificial intelligence for global accessible parking spot detection and database maintenance, accessible via interactive maps. This approach aims to provide accurate, up-to-date information, overcoming limitations of current data sources and enhancing accessibility for individuals with reduced mobility.
2. Literature review
2.1. Artificial Intelligence
Deep learning (DL), particularly Convolutional Neural Networks (CNNs), revolutionized image classification in
2012 (Krizhevsky et al. (2012)). This advancement extended to object detection, leading to diverse methodologies for detection and segmentation. Currently, two primary detector families dominate: two-stage methods (Girshick et al. (2014), Ren et al. (2017)), often employing Recurrent Neural Network (RNN) architectures, and one-stage methods (Redmon et al. (2016), YOLO (2024)), leveraging CNNs. More recently, Transformer-based architectures have emerged as an alternative (Carion et al. (2020)). In Intelligent Transportation Systems (ITS), the methods described above for image detection and object recognition have been applied to traffic-sign detection in street-view imagery. This is exemplified by the seminal work of Zhu et al. Zhu et al. (2016), which introduced the Tsinghua-Tencent 100K benchmark, presented an end-to-end detection and classification pipeline, and paved the way for the adoption of single-stage detectors within the ITS domain.
2.2. Satellite Imagery
Aerial and satellite imagery has been traditional tailored to geospatial data and used for mapping and surveying, environmental monitoring, agriculture control, etc. The advancement on image classification and detection has empowered the classical uses and opened the possibility of solve new problems by using image tilling (breaking large satellite images into manageable chips for DL methods) in order to do segmentation and classification (Ulmas and Liiv (2020)), object detection (Kang et al. (2022)) and georeferencing (Khatua et al. (2024)).
2.3. Intelligent and Transportation Systems Satellite imagery
In ITS, satellite imagery has been used for limited use cases such as estimating traffic volumes in cities Larsen et al. (2009) or for the detection of parking places Zambanini et al. (2020). The limited use of satellite imagery comes from the low frequency of data acquisition, as satellites typically revisit a specific area only once every two weeks. This makes it unsuitable for real-time applications like traffic forecasting or parking occupancy prediction, two of the most common use-cases.
2.4. Literature-informed proposal
Building upon the existing literature and the context outlined in Section 1, this study proposes using artificial intelligence on satellite imagery for automated detection of accessible parking spaces, motivated by the low frequency of new space creation. For the detection method, the YOLO algorithm Redmon et al. (2016) will be used based on literature highlighting the superior performance and widespread adoption in ITS.
3. Theoretical considerations
3.1. Deep Learning methods for image detection
CNNs are central to contemporary deep learning (DL) object detection, as detailed in Section 2.1. These networks consist of interconnected convolutional layers that extract visual features by applying learnable filters, producing feature maps. Pooling layers follow to reduce complexity and improve translation invariance. Subsequent fully connected layers act as classifiers, outputting the final classification based on learned convolutional features. For object detection, the model predicts object class and bounding boxes. One-stage detectors, like YOLO, perform this in a single forward pass, offering greater computational efficiency than two-stage or Transformer-based methods. YOLO’s development has centered on backbone-neck-head architectural enhancements for feature extraction, aggregation, and final prediction (bounding boxes and confidences), with recent efforts improving small object detection, vital for satellite imagery analysis (YOLO (2024)).
YOLO models offer different metrics in order to evaluate the quality of the model to the trained task. From those, the ones that are used in this work are:
- Intersection over Union (IoU): Intersection over Union (IoU) quantifies overlap between predicted (Bp) and ground truth (Bgt) bounding boxes, ranging from 0 (no overlap) to 1 (perfect). A threshold of 0.5 commonly defines a true positive.
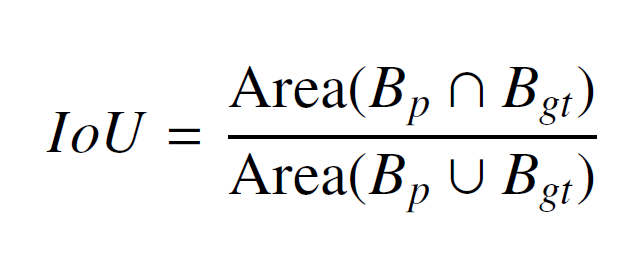
Where:
– Area(Bp ∩ Bgt): The area of the overlapping region between the predicted and ground truth bounding boxes.
– Area(Bp ∪ Bgt) = Area(Bp) + Area(Bgt) − Area(Bp ∩ Bgt): The total area covered by both bounding boxes.
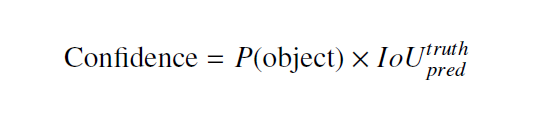
- Confidence: YOLO’s bounding box confidence indicates the model’s certainty of object presence and box accuracy. Calculated as the product of two probabilities: probability of an object being present in the bounding box (P(object)) and the Intersection over Union (IoU) between the predicted bounding box and the ground truth bounding box (IoUtruthpred)
- Mean Average Precision at 50% IoU (mAP50): mAP at a specific IoU threshold (e.g., 0.5) calculates the Average Precision (AP) for each object class (APi) and then averages these AP values across all classes.
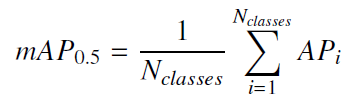
Where APi is computed by finding the area under the Precision-Recall curve.
3.2. Satellite imagery
The theory of satellite imagery encompasses data acquisition, its subsequent transformation, and the diverse sensors employed, which significantly influence the ultimate utility of the acquired images:
- Data Acquisition: Satellites use sensors to record reflected/emitted electromagnetic radiation across various wavelengths. Sensor design (spectral range, spatial resolution) dictates captured information.
- Preprocessing: Essential for correcting distortions:
- Geometric Corrections: Rectify spatial inaccuracies (viewing angle, Earth curvature, sensor geometry) for accurate overlay with other datasets.
- Radiometric Corrections: Address errors in radiation intensities (atmospheric effects, sensor calibration, solar illumination) to ensure accurate surface reflectance/emittance representation.
- Image Enhancement: Improves interpretability for analysis.
- Derived Products: Tailored for specific applications; for object detection, orthorectified images (geometrically corrected for terrain relief and sensor perspective, providing uniform scale) are crucial.
Different sensor types include:
- Optical Imagery: Captures visible and near-infrared reflected sunlight, analogous to human vision but with multiple spectral bands.
- Radar (SAR) Imagery: Actively transmits and measures backscattered microwave radiation, enabling day/night and cloud-penetrating capabilities.
- Multispectral Imagery: Captures data in a few (3-10) broader spectral bands (including infrared), allowing analysis of surface composition and condition (e.g., vegetation health, water quality, land cover).
- Hyperspectral Imagery: Captures data in hundreds/thousands of narrow, contiguous spectral bands, providing detailed spectral signatures (”fingerprints”) for material identification (e.g., paint on signs) and subtle property variations.
More details about satellite imagery theory can be found in Economy (2023); Houtz (2024)
4. Methodology
4.1. Data preprocessing
A large satellite image of 14cm/pixel resolution is acquired from a satellite image provider (UP42) after specifying the desired area. This large image is segmented into smaller and tractable tiles (tessellation) that are then projected to Mercator EPSG:3857, obtaining XYZ tiles. The obtained tiles are then filtered by using the information provided by city planners (usually from a shapefile) in order to discard areas without roads. Finally, tiles are merged into sets of 9 adjacent tiles in order to create fixed-size images (256×256). This merge of 9 tiles has shown to be effective in avoiding having parking spots divided between images.
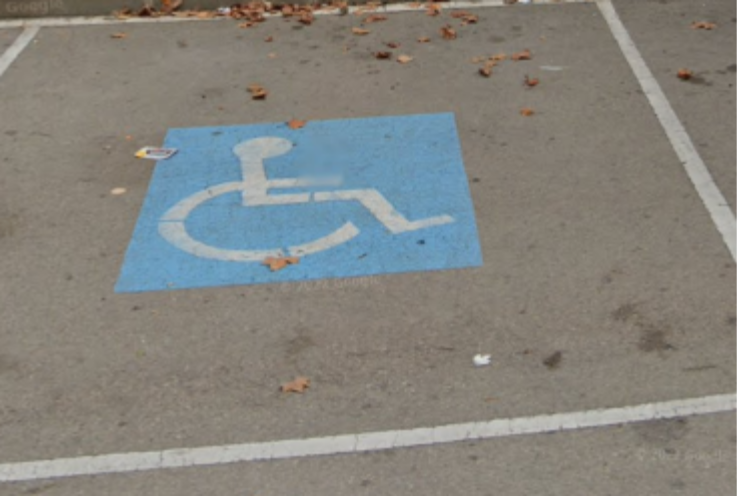
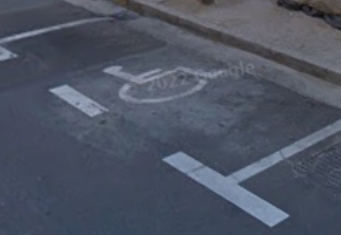
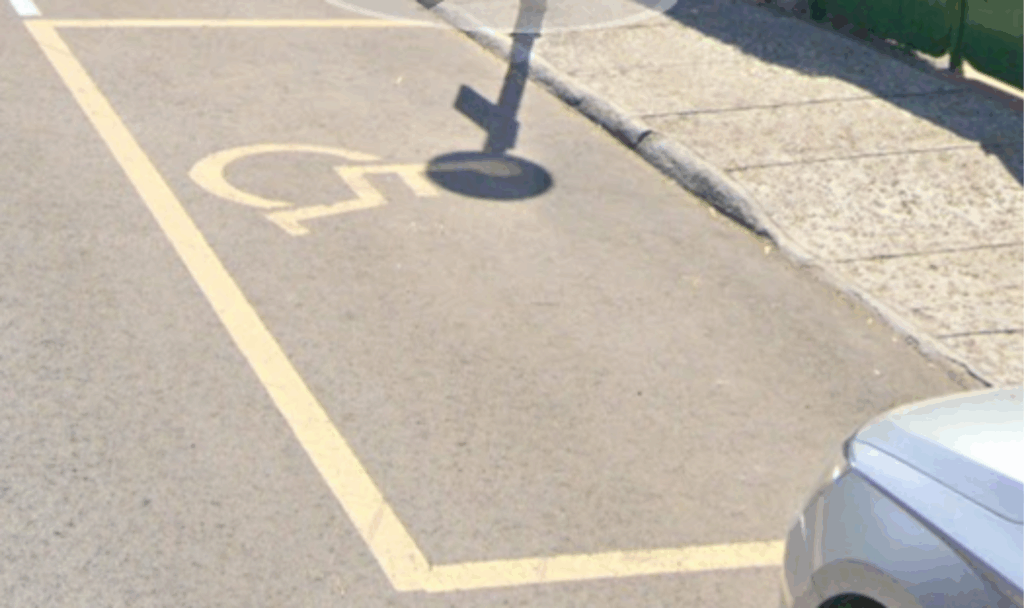
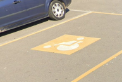
Following image acquisition, a subset of the images undergoes manual annotation to label ground traffic signs indicating the location of accessible parking spaces, specifically the V-15 signal (Figure 2). This annotation process is performed using the CVAT software CVAT under the following premises:
- Label only if 75% of the sign is visible due to an object occlusion. (If sign is cut at an edge of the image the sign should not be labeled).
- Label only if sign is visible and detectable. We must avoid cases where image quality is so bad the presence os a PRM spot can only be guessed.
- V15 icons can appear in different styles. If it is recognizable and generic it can be labeled.

Where open data concerning PRM parking locations is available for the city being processed, this information is utilized to guide the annotation process. Due to the heterogeneity of V-15 signage across and even within cities, a standardized nomenclature is employed during image tagging. Each tag adheres to the format V15-XYZ where X is the sign color, Y is the background color and Z is the background shape. In addition, the piano tag is used as PRM spots are delimited with white lines that delineate the boundaries of each parking spot. Examples are presented in Figure 3.
background (alpha).
background, rectangle shape.
background, rectangle shape.
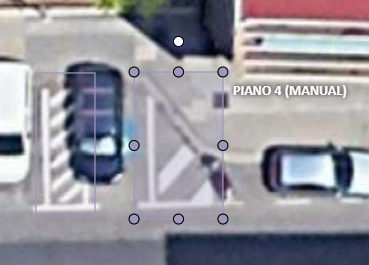
the PRM zone.
Fig. 3: Examples of various markings indicating a designated PRM parking space.
Using the tagged images, a YOLO model is trained to learn the visual features of the V-15 signal. Following training, the remaining images are employed to evaluate the model accuracy in detecting accessible parking spaces. In case of already having a trained model, the annotation and training phases are bypassed, and the images are directly processed by the model for automated detection of accesible parking spaces.
4.2. Model output
Figure 4a shows an output of the model, clearly showing the detection of the four accessible parking spaces present in the image. For each detected marking, the model provides its classification tag and the associated confidence score. Observe that the model also exhibits a false positive detection with a confidence of 0.5, misclassifying a sewage cover as a V-15 signal. Figure 4b displays another image with the model detections, demonstrating a failure to detect one of the PRM parking spaces. To mitigate the occurrence of false positives, a filtering mechanism is implemented by applying a minimum confidence threshold for accepting a detection as valid, complemented by manual verification. Finally, the detected PRM parking spaces are georeferenced, and the information is exported to the database.
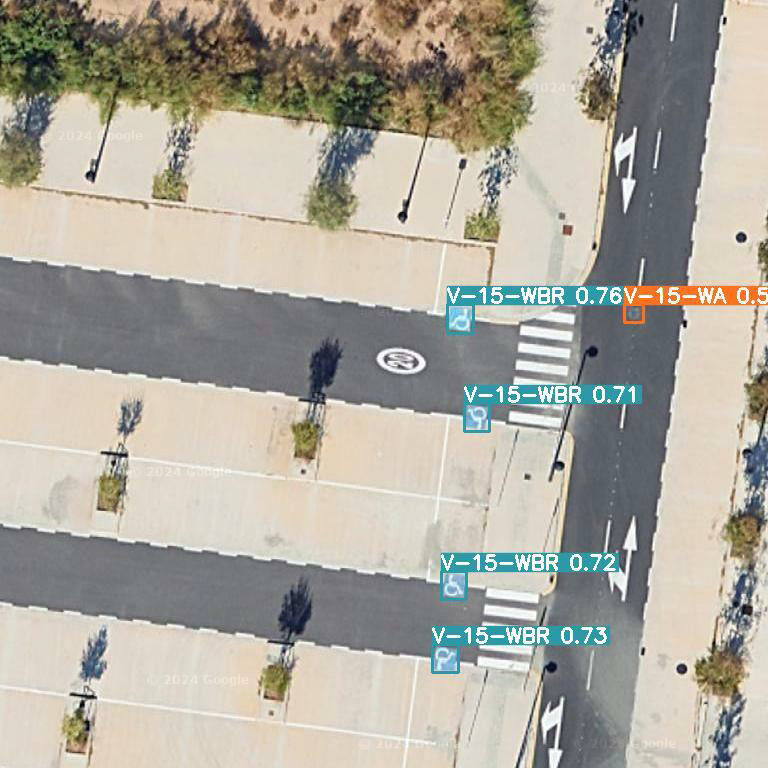
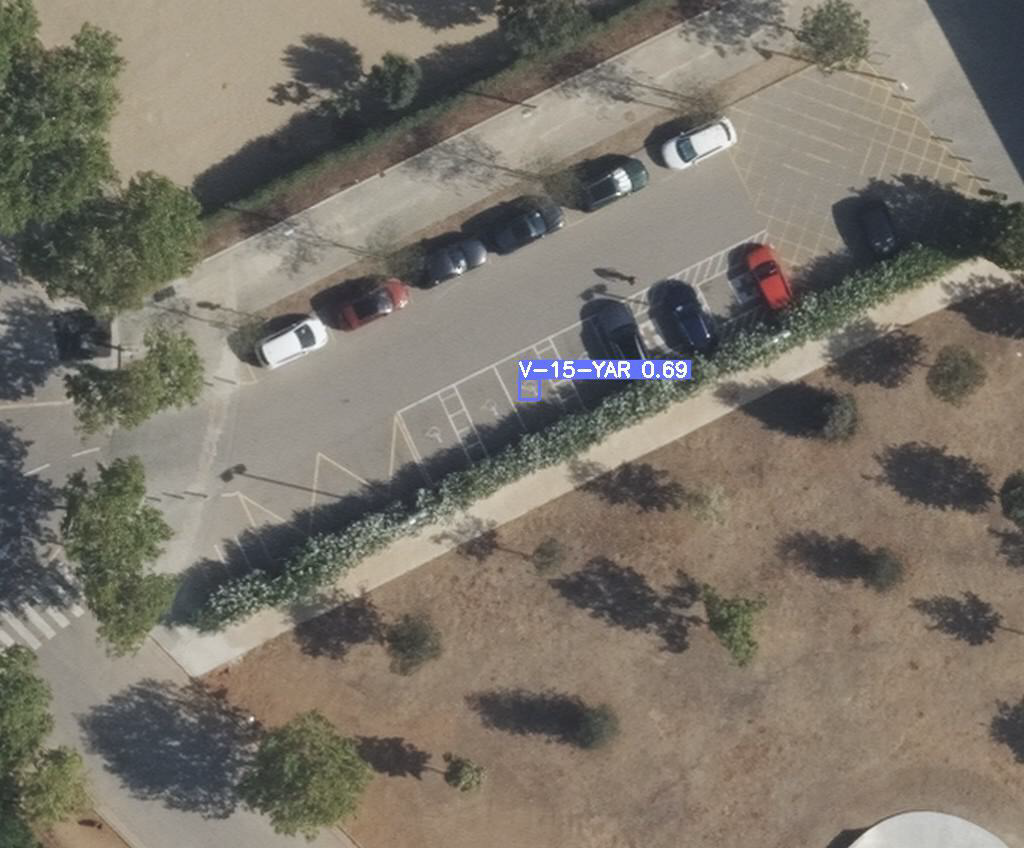
Fig. 4: Images with detections from the model.
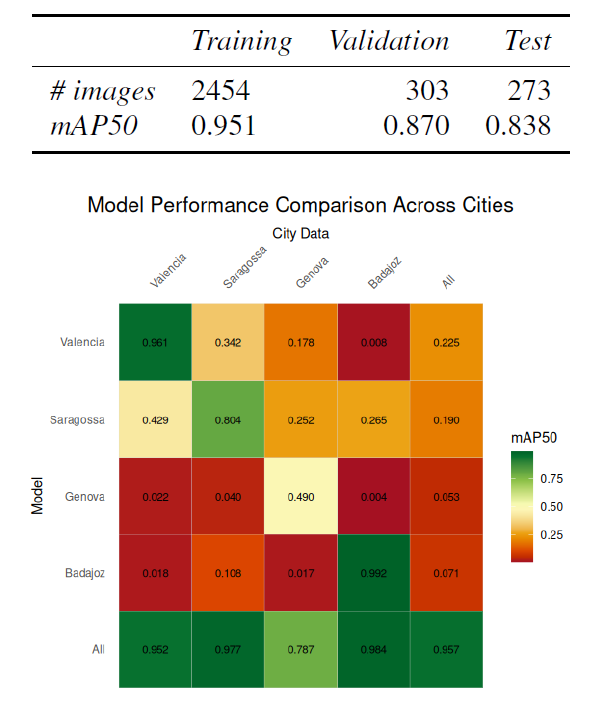
Table 1: General results obtained from the model trained with images from all cities.
5. Results
As part of the project, the proposed system underwent testing in four pilots: Valencia, Zaragoza, Badajoz, and Genova.
Experiments employed two training strategies: city-specific models versus a unified model across all cities. Figure 5 compares the resulting mAP50 scores, indicating poor generalization by single-city models, while the unified model achieved more balanced and better performance. Notably, the Genova pilot showed lower scores in the unified model. Manual review revealed this was due to the smaller size and distinct tagging (”V-15-WBR”) of the V-15 signal in Genova compared to Spanish cities, causing model confusion. Table 1 displays the overall results achieved with a model trained on images from all pilots. These findings suggest that the proposed approach for detecting PRM parking spaces across different cities using satellite imagery is feasible, although further optimization is possible.
6. Conclusions and future research
6.1. Conclusions
The obtained results seems promising and confirms that the proposed approach to obtain the PRM spots of a city is viable and that a unified model is the way to go but the disparity in referencing criteria for PRM spaces across cities compels the development of classification models accommodating diverse ground signage, hindering a unified model, as seen with the inclusion of Genova.
The proposed method exhibits inherent limitations stemming from its reliance on satellite imagery:
- Occlusions: Obstructions such as building shadows, parked vehicles within PRM spaces, and tree canopies frequently impede the detection of parking markings. While temporal image fusion during preprocessing can mitigate this issue by integrating multi-temporal views of the same location, complete elimination is challenging.
- Restriction of use: The inherent perspective of overhead imagery precludes the acquisition of information regarding usage restrictions for PRM spaces, which is typically conveyed through vertical signage at street level.
- False Positives: Despite the system high reliability, the heterogeneity of ground markings and visual similarity between semantically distinct signs (e.g., V-15 and bicycle lane markings) contribute to false positive detections. Increasing the volume of training data is expected to reduce the occurrence of such errors.
6.2. Future work
While the research questions from Section 1 have been answered, the system has limitations in determining usage restrictions and detecting occluded PRM spots, indicating unfulfilled goals. Future work should explore street-level panoramas, which could provide information from vertical signs and mitigate occlusions.